Every control system shall contain a user interface which provides fast overview of the controlled processes and comfortable setting of parameters. The first question in the decision process should be: who is going to work with the system? Will it be…
Every of the above mentioned roles – and surely more of these could be found – needs a bit different set of data, with different presentations and on different terminal devices. This is why choosing the right platform for every installation is so important both for the designer and for the user.
 Topologies of the visualisations
Lately, web access is very popular: the web server is usually part of the PLC, its engineering is less demanding than a full-sized SCADA, and the client – web browser – needs no licensing. On the other hand, network security is an issue here, as a publicly available PLC web server is far more subject to network attacks than a PLC itself. The PLC, unlike a web server, works in a closed network and communicates mostly using proprietary protocols, usually protected at least by a password.
Another option is a simple client, a mobile application. It offers access to the PLC from virtually anywhere, provided that the PLC is accessible over an open proprietary communication protocol. The access is protected by username and password, with encrypted communication as an option. A mobile phone or tablet are suitable for quick check of actual values, alarm acknowledgement, or changing of setpoints and time schedulers.
Web access and mobile application in the Domat system are further referred to as Merbon HMI, as their functionalities are more or less equal. Their primary aim is to provide the interface between the operator and the PLC, the Human-Machine Interface, for simple operation and monitoring of actual values.
A standard SCADA is perfect for comfortable operation from a workplace with permanent connection to PLCs. It has two forms: a client software and a web SCADA. A client software is a program which runs on a PC. It connects to one or more PLCs, reads data and displays them in technological schemas. Other functions are trending, overview of active alarms, alarm and event logs etc. A web SCADA offers the same functionality, but it works as a service – web server, which is accessed by the clients using web browsers. This means that the server can be accessed from other workplaces in the local network or in the Internet, and there may be more users working over a single plant at a time. However, the main focus is on actual values and trend data.
A completely another approach is represented by an energy management system, e.g. ContPort. Its main functionality is long-term data storage and trend data analysis together with other functions which support facility management, data analysis, service workflows, and energy management. Instantaneous process values are not so important anymore, as users do not deal with operative tasks: they analyse data in a long-term range of days, weeks, months, and years.
As tender specifications are written, the SCADA and management system functionalities are often merged or even confused. However, as soon as the plant starts operation the roles of the operator and energy manager are splitted, and both parties may find that the visualisation does not comply with their requirements. Some problems can be fixed easily by assigning user rights. At larger systems with about 10 000 datapoints and more may be more useful to have a separate SCADA for operative tasks, and to design the energy management system as an offline tool with strong bindings to ERP systems. The interface between SCADA and the energy management system is a shared database of trend data or an API – application programming interface for data exchange between systems, as seen on the image above.
A typical task is the DCIM (Data Center Information Management) design. Apart from the operative tasks like alarm handling and monitoring of values from several thousands of measuring points, the system should also be able to assign racks and measured power outlets to customers, energy readouts, and management of service tickets. SCADA and energy management system functions are merging with facility management and accounting. These systems are always customized, as the requirements are very specific and there hardly is an existing system which meets all customer wishes completely.
In the following table there are visualisation tools supplied by Domat, and their main properties.
| Merbon HMI | SCADA | ContPort | |
| User policy | limited | ✔ | ✔ |
| Instant values display | ✔ | ✔ | - |
| Technology schemas | ✔ | ✔ | - |
| Setting of process parameters | ✔ | ✔ | - |
| Trend data storage | - | ✔ | ✔ |
| Technological alarms | ✔ | ✔ | - |
| Energy management alarms | - | - | ✔ |
| Infrastructure management (Business relations, Objects, Devices and Parts) | - | - | ✔ |
| Dashboards and KPI | - | - | ✔ |
| Data processing and analysis | - | - | ✔ |
| Reporting | - | - | ✔ |
| Ticketing | - | - | ✔ |
User policy means that more users can be defined in the system, be it using a name („Smith“) or role („Engineer“), and individual setup of access to system functions. Local operation, like a LCD display or touch terminal in a panel, may be protected by a PIN at several levels. Unauthorised access is prevented by location – keys from the machinery rooms are only available to authorised staff. A standard SCADA, mainly that with remote access, should be protected by standard IT tools: computer passwords, program passwords, regular checks and deletion of obsolete users, etc.
Instant values display is visualisation of online data with minimum delay caused only by internal communication within the system. Usually this is several seconds. Operators may act according to current situation, and check if the plant is performing smoothly. The display may be in tabelar form, menu tree on a display, or using a simple schema with current values. This kind of data display is suitable for operative control. It is not necessary for a energy management system, which reads data from a database e.g. every 15 minutes.
Technology schemas are images with embedded “live” values. The schemas are customized for a particular plant, and represent staple tool for work with a SCADA system.
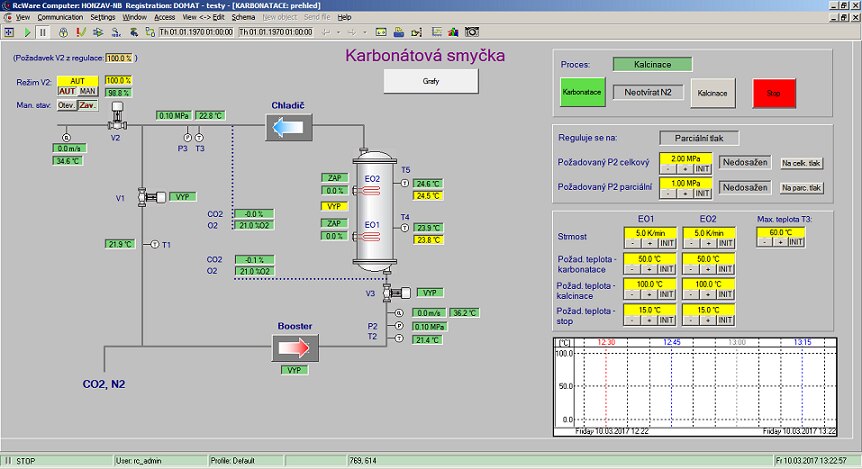 Fig.: Technology schema of gas carbonation, with controls and trend in the right panes
Setting of process parameters: Users can modify temperature, humidity, pressure etc. setpoints, enable device operation, edit time schedulers, and optionally set aggregates, valves and other peripherals to manual mode. These activities only should be performed by trained and authorised staff members, who also carry full responsibility for their actions. This is why the energy management system does not provide this function - this is the operators’ task.
Trend (or history) data storage means archiving of measured and recorded values for years and more. It is not necessary for local operation, where online trends of last about 6 to 48 hours are sufficient enough. However, it is of great importance in SCADA systems where it helps to analyse proper operation of the system (hunting valves…), and in energy management systems. While line graps are OK for most of SCADA trends to see the values in time, energy management systems use more sophisticated data presentations, such as modulo graphs (time periods, such as weeks, repeating on the X axis), carpet, bar, and pie graphs etc.
Technological alarms: indication of alarm states or system malfunctions as pop-ups, SMS messages, e-mails etc. It is a pure operative functionality, therefore alarms are acknowledged and reset on the two “lower” levels (HMI and SCADA). It is even not possible in the energy management system, as the information flow goes from PLCs to databases, rather than the other way around.
Energy management alarms represents handling of alarms which originate at the energy management level only, based on evaluation of history data. These are not technological alarms such as pump failure, or air handling unit frost alarm, which are operative alarms. A typical energy management alarm is a notification that a particular device or building shows too high energy consumption compared with the last period of evaluation, and it would be worth to learn if the system is operating improperly or even completely down (and if so, then why).
Infrastructure management: this is e.g. rack assignment to customers and preparation of invoicing data in a DCIM system. In a shopping center, it may be tenant management, energy readouts, meter management (events like heat meter replacement), cost allocation etc.
Dashboards and KPI are the top of the energy management system. A dashboard is a screen which displays the most important system data: alarm overview, key values and their position in their limits, number of open service tickets, and infrastructure load. The KPIs (Key Performance Indicators) are criteria for evaluation of energy efficiency of the building and its technologies, and should be in the main focus of the energy manager. In a data center it is e.g. the PUE (power usage efficiency), in buildings it is energy consumption per square meter or per volume unit and year. These indicators are often compared between similar buildings (benchmarking).
Data processing and analysis: more complex algorithms, which use trend data as inputs. A typical example is the degree days calculation in district heating, and their comparing with consumption in different buildings. The calculations are specific for the technology monitored, and defined by customer needs. Data are processed either in regular intervals on a batch basis, or at the presentation time – when a report is created or viewed.
Reporting means automatic or manual creation of formatted reports, exported mostly as PDF files or Excel tables. Reports are the main documents for basic analysis which may lead to more detailed data examination and discovering of problems causing energy inefficiency.
Ticketing, or service activities control: control over the whole chain, consisting of problem occurrence, problem discovery, diagnostics, service ordering, service activity, handling over the service report, confirming and paying the invoice, and closing the ticket. The service ticket is a defined process. It is possible to see how many tickets are unresolved (open), what activities are required, what are current costs etc. Linking of this management of service costs with operation costs (especially energies) monitoring may provide important information regarding total ownership costs and their optimization.
It is apparent that if a house technician operates an energy management system or an energy manager works with a simple plant graphics using a web browser, neither of them will be able to do his work properly. Selection of a proper visualisation platform is essential for regular and efficient building operation, and should be considered mainly by the building system designers. The problem is that often it is not clear how the building shall be operated, until the final handover to the end customer. The designers should specify – together with the system suppliers and end users – who and how will operate and maintain the building, if there is a central workstation planned, and if the data will be communicated into enterprise systems, and – based on this – select the proper visualisation platform for each group of users.
